
Your Synthetic Users primer
Answering big questions for you before you're expected to at work.

✌️ Hey, I’m Caitlin. I help product, design, and insights folks do better customer research with AI—without the hype.
Dive deeper: Claude Code for Customer Insights (Sold out! New dates coming soon) | AI Analysis Course (June) |
You’re going to be in a meeting soon where someone says “we should use AI to simulate our users.” Maybe they already have.
The promise is compelling: simulate thousands of users in minutes instead of recruiting them over weeks, or months, or not at all because your B2B audience is too hard to recruit.
Test pricing, messaging, feature concepts — all without a single interview. Some studies report 85% accuracy. Vendors are selling it. Teams are talking about it. And the market is projected to hit $4.6B by 2032.
But the gap between what synthetic users can reliably do and what most teams think they can do is where bad product decisions get made.
A synthetic user that’s wrong 15% of the time sounds alright to some — until you realize that the 15% might actually be a bigger number, and that the errors cluster around the questions you might care most about: will they adopt, will they pay, will they switch?
This is the primer you read before that meeting, where someone senior suggests using whatever data you have to create synthetic simulations of your customers. I want you to know just how to challenge their assumptions. It’s a summary of many major studies in the space, plus learnings from 30+ experiments I ran myself.
I genuinely hope this helps you - not just to become more skeptical but to begin thinking more realistically about where synthetic users could have a future in your work, too. ✌️
In this edition:
🧩 “Synthetic users” isn’t one thing — multiple types and what each promises
🔬 What the research says when you line up the studies side by side
🧭 Where this leaves you when someone asks, “can we use synthetic users?”
Let’s get into it —
🧩 What are “synthetic users”? Not a single thing.
People use one term to mean many things. There’s little consensus on terminology across HCI, marketing, cognitive science, and AI research.
The biggest variable is often the data you feed in — but not always. How you ask the question matters too. Here are the main approaches and what each requires.
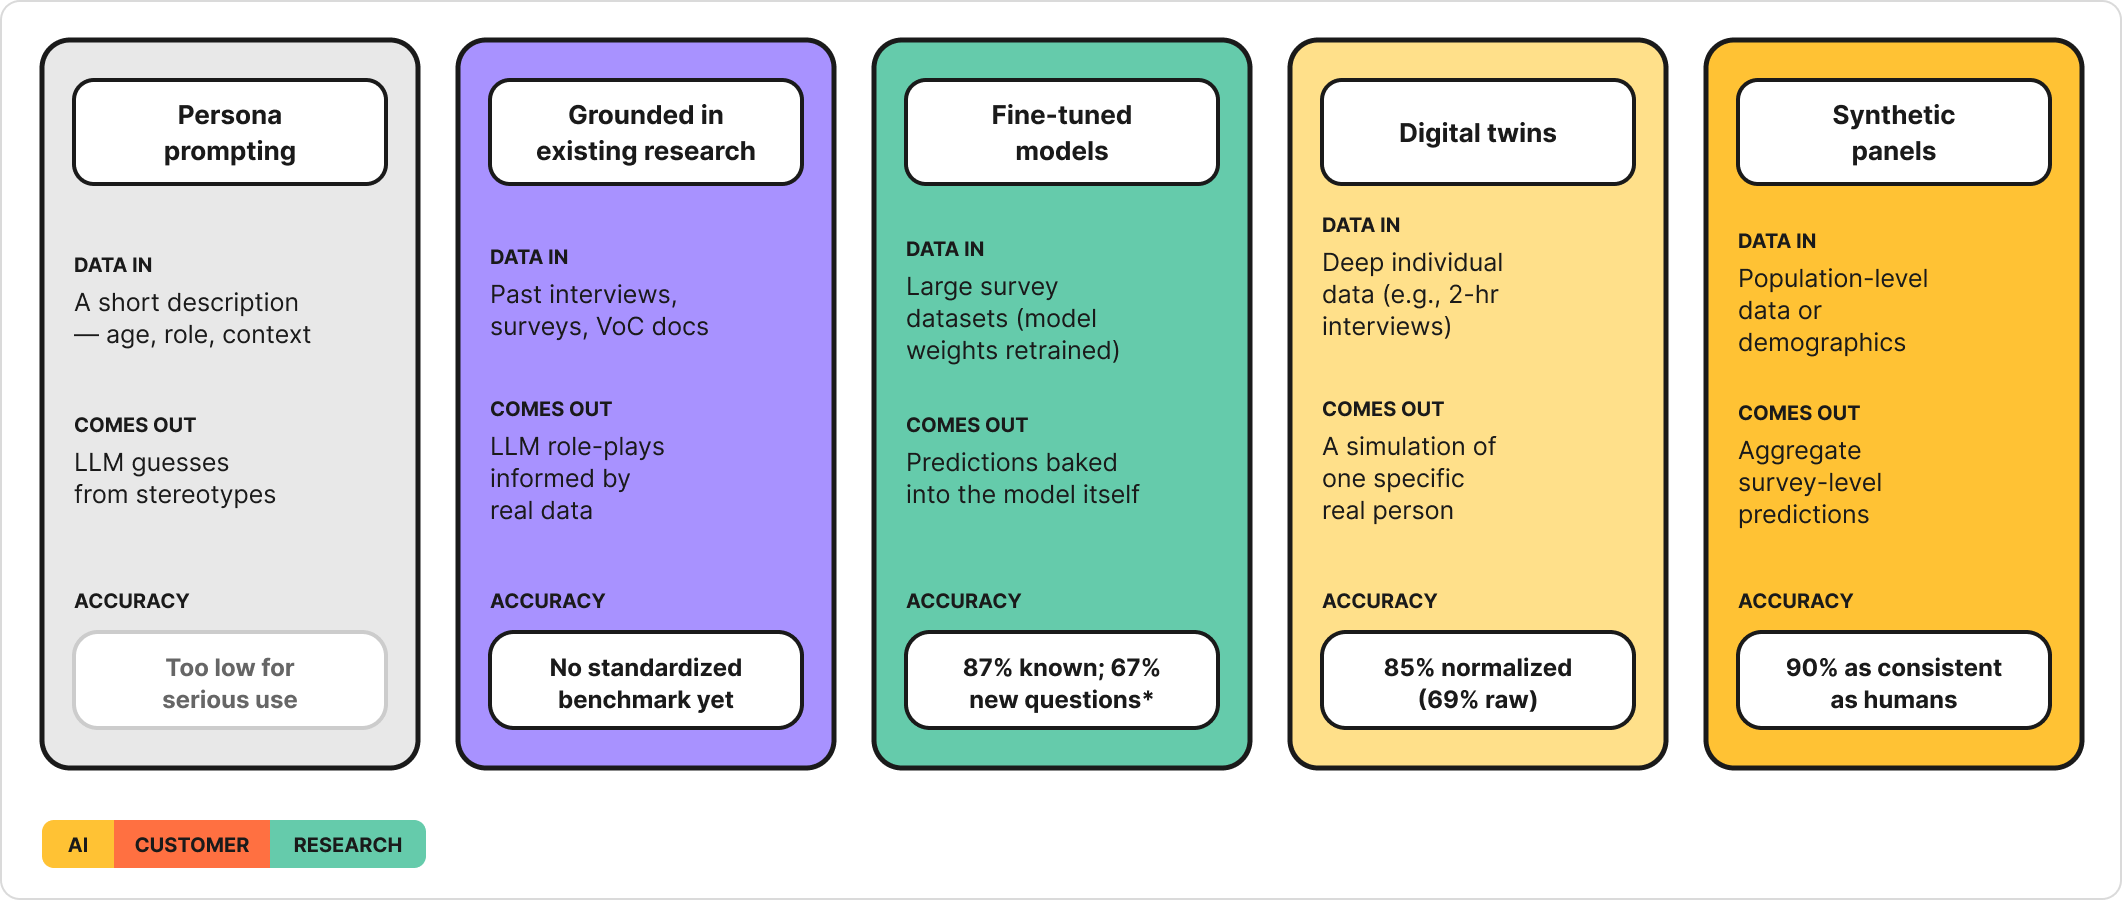
Every jump in accuracy costs a jump in data investment. But the numbers in this table can’t really be compared to each other directly — and that’s one of the biggest challenges in this space right now.
A note on persona prompting: This is what most teams try first — open an LLM, describe a user, ask it to respond as that person. No real data goes in, so accuracy is near-zero (Peng et al. 2025/2026 found just 15% correspondence for demographics-only prompting). It’s included here because you’ll likely encounter it at work, not because it’s a viable research method.
📍 Tip: When someone says “synthetic users,” ask which type they’re referring to, how they think you’ll create them, and which data they’d use. The answer changes everything about what you should expect from the output.
Why you can’t compare these numbers to each other
The accuracy numbers in the table above come from different studies, measuring different things, on different tasks. “85% accuracy” from one study and “20% correlation” from another don’t mean one is better and the other is worse. They measured completely different questions.
Here’s what’s often being measured:
Normalized accuracy (used by Park et al. for digital twins) asks: “Did the synthetic user pick the same survey answer as the real person?” — then adjusts for the fact that humans don’t always pick the same answer themselves if re-asked. The 85% means the synthetic user got 85% of the way to the human consistency ceiling. Sounds high. But the raw match rate was 69% — roughly one in three answers was wrong.
Correlation (used by Peng et al., Hewitt et al., Kim & Lee) measures whether synthetic and real responses move in the same direction — but different studies correlate different things: from comparing one synthetic user’s answers to one real person’s answers across all humans/synthetics and their answers, to comparing predicted effect sizes vs. actual ones across experiments. A high correlation means the patterns track. It doesn’t tell you how many individual answers were right or wrong.
Correlation attainment (used by Maier et al. for synthetic panels) asks: “How close is the synthetic-to-human correlation compared to the human-to-human test-retest correlation?” The 90% means the synthetic panel tracked 90% as well as humans re-answering the same survey — a strong result, but specifically on purchase intent for known product categories.
〰️
Why this matters for you:
When someone at your company says “this synthetic user tool is 85% accurate,” the first question should be — 85% on which accuracy measure?
Normalized accuracy on structured survey questions from an established social science questionnaire?
Raw match rate?
Correlation?
Correlation attainment?
These give very different pictures.
Two studies can test the same method of creating synthetic responses — like digital twins built from deep individual data — and get 85% on one metric and 20% on another, because they tested different tasks. The 1000 person study’s 85% accuracy result was on structured attitude questions. Peng et al.’s 20% result was on behavioral and psychological outcomes. They used similar approaches to creating synthetics, but got very different results.
🔬 What the research says
I’ve lined up many major studies published in the last several years. The headline numbers often look impressive. The details are messier — and as I said, the input data used matters most.
Here’s what the evidence shows, organized by finding.
Finding 1: Data depth drives accuracy — more than the model or method
The Generative Agent Simulations of 1,000 People study (Park et al.) is the study that’s probably shown up most in your Linkedin feed. They created digital twins from 2-hour semi-structured interviews averaging 6,491 words per person, with 1,052 human participants.
One of their most useful comparisons - they tested how much the input data mattered:
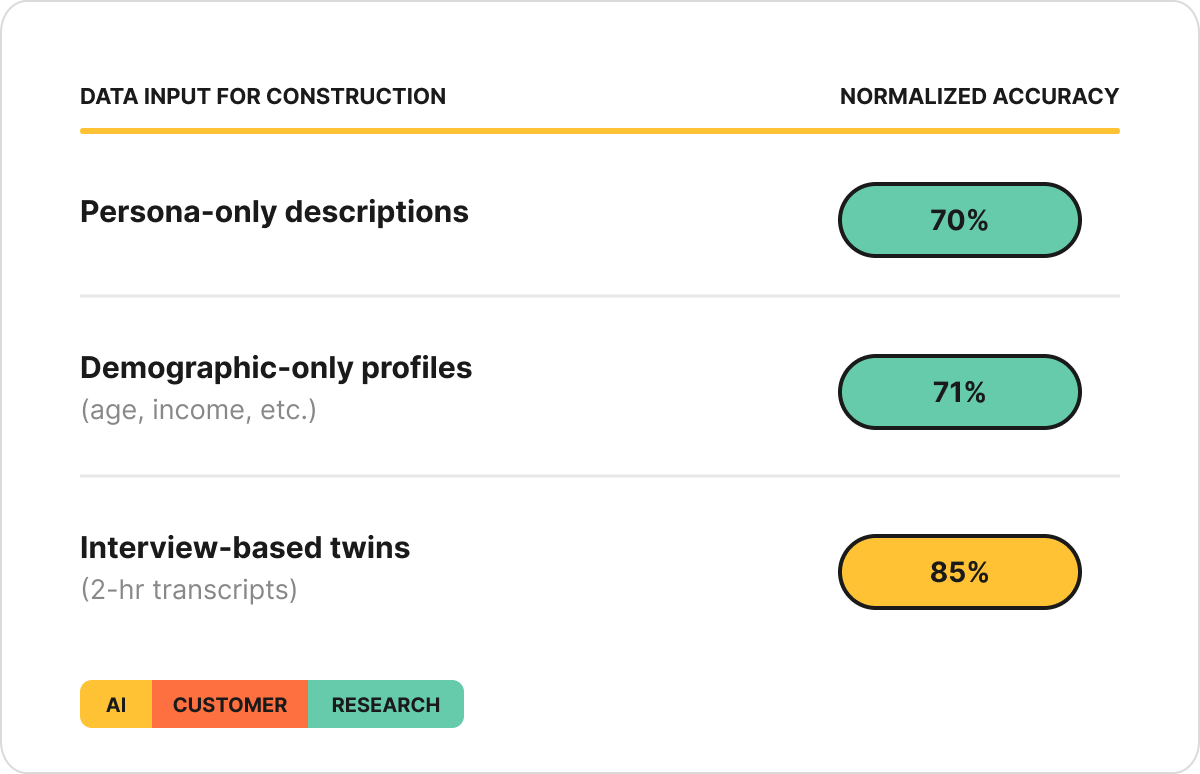
That 14-15 point gap between persona-only descriptions and the full interview-based twins tells you data depth is a variable that matters.
Columbia’s Twin-2K-500 study (Toubia et al.) confirmed it from a different angle: they tested 12+ method variations for constructing synthetic users — different prompting strategies, different models, different data formats. Everything clustered between 67.88% and 71.92%. Fine-tuning (69.61%) performed worse than base prompt augmentation (71.72%).
What’s “prompt augmentation”? Loading real data — like interview transcripts or survey responses — directly into the LLM’s context window before asking it to respond. No model retraining required. Just giving the AI more to work with.
What’s “fine-tuning”? Retraining the model’s weights on your data — more expensive, more technical.
The authors of the Twin-25-500 study found that accuracy was remarkably similar across all synthetic user creation approaches — suggesting that once you have the data, the specific method you use to build the synthetic user matters less than you’d expect. Reading across both Park and Toubia studies, the implication is clear: data depth matters more than engineering.
〰️
Finding 2: Synthetic users get the direction right — but exaggerate how big effects are
Predicting Results of Social Science Experiments Using LLMs (Hewitt et al.) tested synthetic predictions across 70 experiments and 105,165 participants. The model hit 85% correlation with 90% directional accuracy — it usually got which way people would lean right.
But it exaggerated how big the effects were — by nearly 2x. If a real experiment found that a message changed people’s attitudes by 10 percentage points, the model predicted it would change attitudes by roughly 19. It knew the message would work — it just overestimated how well.
Direction right, magnitude wrong.
If you’re asking “will users prefer option A or B?” — synthetic users are directionally reliable. If you’re asking “by how much?” — treat the number with serious skepticism.
〰️
Finding 3: LLMs are systematically biased — in consistent, documented directions
The Mega-Study of Digital Twins (Peng et al.) tested a hugely data-intensive approach — 500+ real survey answers per person, ~128K characters of data. The result: just 20% correspondence across 164 outcomes — meaning the model explained less than 4% of the variation between people.
Five systematic distortions they identified:
Stereotyping — over-reliance on demographic cues
Insufficient individuation — responses cluster toward the mean. In 93.9% of outcomes, synthetic responses showed less spread than real humans. The models compress the range, making everyone look more similar than they are.
Representation bias — better for WEIRD audiences; worse for underrepresented groups (more on this in Finding 4)
Ideological bias — twins skew toward certain viewpoints. Park et al.’s study showed interview-based agents reduced this by 36% vs. demographic-only — but didn’t eliminate it
Hyper-rationality — too “correct,” too consistent; real humans are messier
〰️
Finding 4: LLMs have a “default human” — and fail where real people deviate from it
The models predict a specific kind of person well and struggle with everyone else. The “default human” is rational, agreeable, and WEIRD-adjacent.
What’s “WEIRD”? It’s an acronym for Western, Educated, Industrialized, Rich, Democratic — the demographic profile most overrepresented in LLM training data and academic research alike.
This tendency toward the default WEIRD human shows up in two ways — who the person is, and how they behave.
By demographic:
A World Values Survey study (Sinacola et al.) tested across 64 countries — synthetic predictions of European respondents scored 67.6% accuracy; Middle Eastern respondents scored 54.0%. A 13.6-point gap driven by which populations are best represented in training data.
By behavior:
The Twin-2K-500 (Toubia et al.) — the starkest failures happen where humans are irrational, polarized, or non-normative:
Vaccine refusal: 45% of real humans refused — only 4% of twins did
Deportation support: ~45% of humans supported it — 74.1% of twins opposed
Anchoring bias: 98.8% of twins gave the correct answer on a question where humans are reliably fooled — the model couldn’t pretend not to know the answer
The study “Out of One, Many” (Argyle et al.) tested vote prediction: 99-100% match for strong partisans, but just 2% for Independents in 2020. The model nails people with predictable views and fails on everyone in between.
〰️
Finding 5: How you ask changes what you get
The same model can give you dramatically different results depending on how you ask the question. The Semantic Similarity Elicitation study (Maier et al.) tested this directly, with two ways of asking LLMs about purchase intent - same models, same products, same demographics:
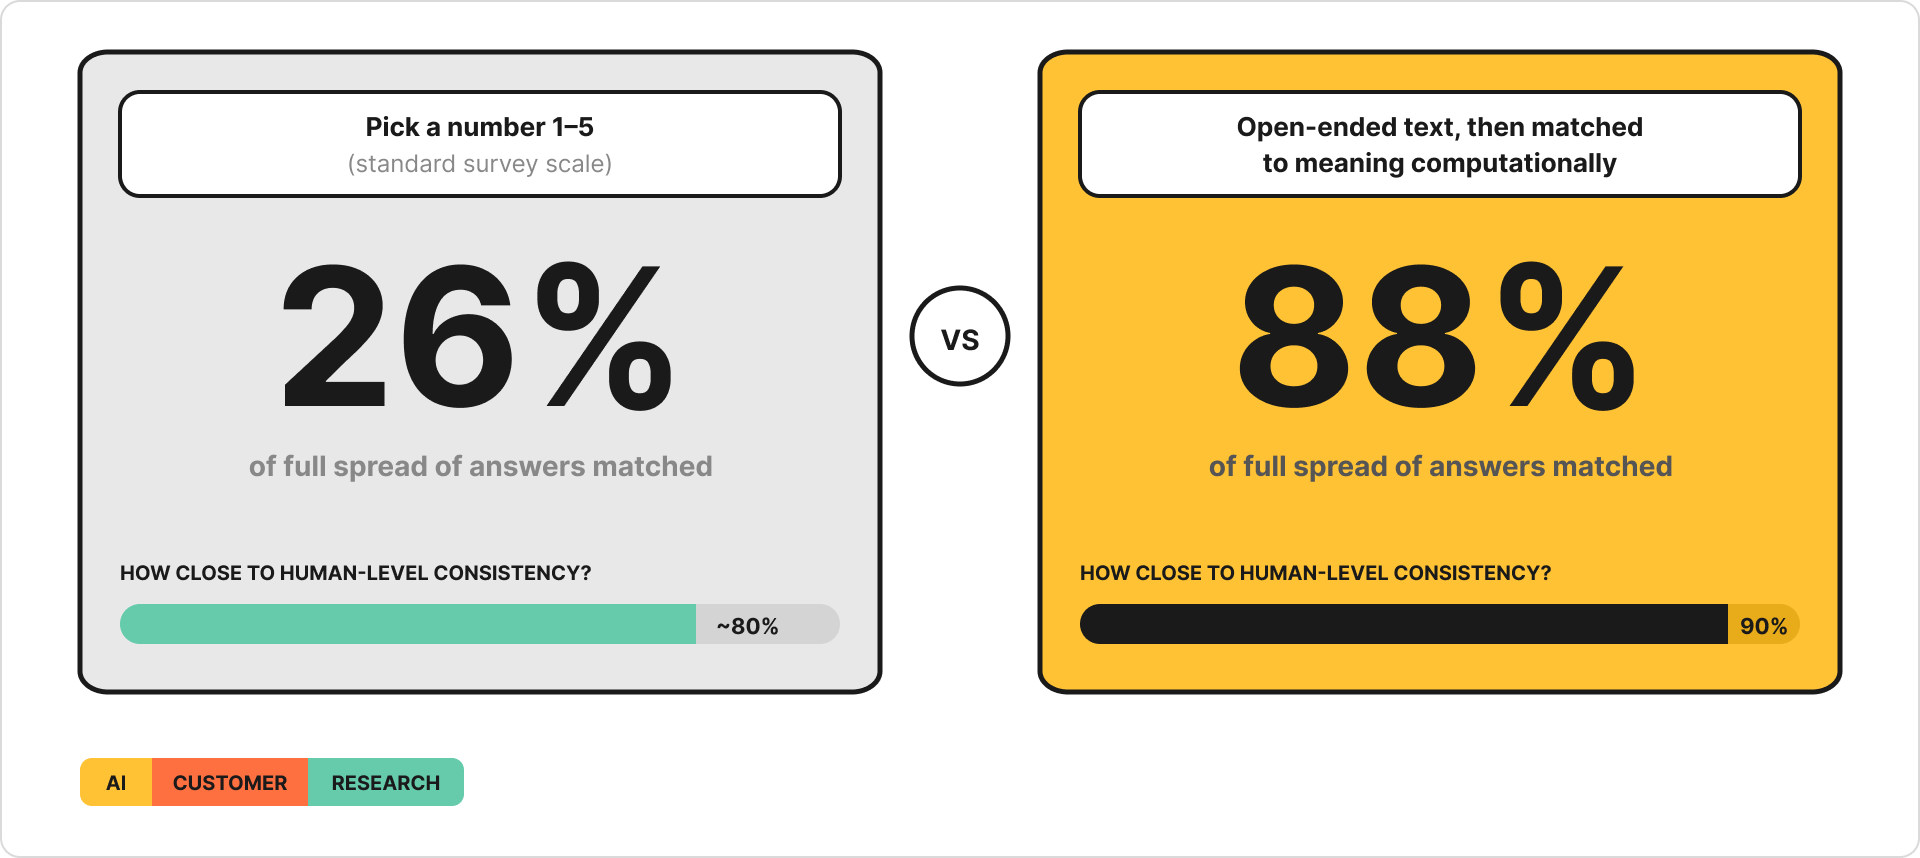
The elicitation method changed everything — across 57 real product surveys and 9,300 human respondents. The study also compared the LLM approach against a traditional machine learning model that had been trained on thousands of real survey responses. The LLM — with no prior training on this data — still won.
〰️
What about real product decisions?
“Using LLMs for Market Research” (Brand et al.) tested whether GPT-3.5 Turbo could estimate how much people would pay for specific product features:
Rank ordering known features: GPT got this right
Estimating how much people would pay: overestimated by 3x on some attributes ($8.20 vs. $2.60 human WTP for fluoride in toothpaste)
Novel features: got the wrong signal entirely — predicted people would pay more for concepts real humans rejected
Demographic subgroups: wildly off. Low-income users: GPT predicted 95% opt-out rate vs. 49% actual
Fine-tuning: when researchers trained the model on one prior human survey about laptops, accuracy improved — including for new features like a built-in projector. But when they used that laptop-trained model to predict tablet preferences, accuracy got worse. The learning didn’t transfer across product categories.
“Can LLMs Replicate Marketing Research Findings?” (Yeykelis et al.) tested replication across 133 published marketing findings: 76% of simple findings replicated, but only ~27% of multi-factor findings did.
The pattern: when you ask synthetic users a straightforward question with a known frame of reference, the output is often useful. The more factors involved — subgroups, novel concepts, magnitude estimates — the less you should trust what comes back.
〰️
Finding 6: The best predictions combine synthetic and real - not one or the other.
The Predicting Social Science Experiments study (Hewitt et al. 2024) compared three approaches to predicting the outcomes of 70 social science experiments: human forecasters working alone, an LLM working alone, and the two combined.
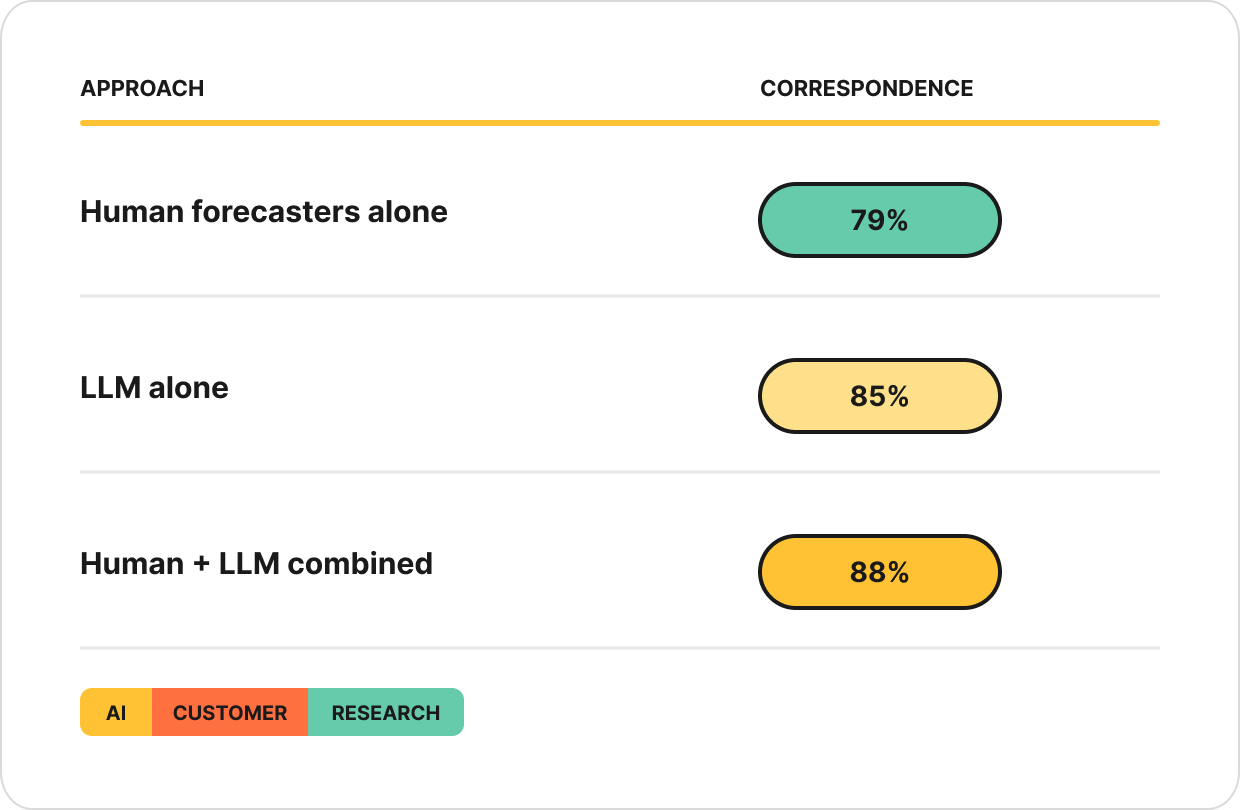
Neither humans nor LLMs were best on their own. The LLM caught patterns humans missed. Humans caught things the LLM got wrong. Together, they were more accurate than either one working alone.
The practical takeaway: synthetic users aren’t a replacement for real research — they’re a layer on top of it. The teams that will get the most from this space are the ones using synthetic outputs to pressure-test, extend, and challenge their real data, not to skip collecting it.
〰️
But are the models just memorizing, or predicting?
No. In Predicting Social Science Experiments, Hewitt and team tested this directly — accuracy on published studies (74% correspondence) vs. unpublished studies that could not have been in GPT-4’s training data (90%). The unpublished studies were predicted more accurately. The models have genuine predictive capacity. But that capacity is calibrated to a specific kind of human, and degrades the further someone is from that default.
🧭 Where this leaves you
The synthetic research market is projected to reach $4.6B by 2032. Gartner predicts 75% of businesses will use GenAI for synthetic customer data by 2026, up from under 5% in 2023.
This isn’t going away.
We need to explore and understand them. Whether you feel skeptical of how synthetic users will be used or you’re curious about this space, we need to understand this well enough to help our teams make better decisions.
Every study I’ve reviewed and every experiment I’ve run points to the same conclusion: synthetic users will be part of the toolkit. The question is whether we use them with our eyes open.
Where synthetic users are strongest
Low-stakes exploration and directional questions on familiar ground:
Rank-ordering known features or options — Brand et al. showed this works even when magnitude estimates are off
“Will people prefer A or B?” — Hewitt et al. found 90% directional accuracy across 70 experiments
Replicating population-level patterns for established product categories — Maier et al. hit 90% of human consistency on purchase intent
Generating hypotheses, edge cases, or assumptions to test with real users — low cost, low risk, useful starting point
Where they’re weakest
Anywhere human decisions are emotional, irrational, or identity-driven:
Willingness to pay — Brand et al. showed GPT overestimated WTP by 3x on some features and got the sign wrong on novel products. Purchasing decisions involve emotional friction, budget anxiety, and “I’ll think about it” inertia that models don’t replicate.
Adoption and switching — in my own tests replicating academic studies, real users said 0/10 willingness to sign up for a given product on the spot; both models tested predicted 6/10. Synthetic users are systematically too willing to try things, too willing to switch, too willing to say yes.
Vaccine hesitancy, political views, and other identity-laden decisions — Columbia’s study found 45% of real humans refused a vaccine but only 4% of twins did. LLMs can’t simulate the accumulated distrust, lived frustration, or personal history that drives these choices.
Underrepresented user segments — accuracy drops for non-WEIRD audiences across every study reviewed. If you’re building for users who aren’t well-represented in English-language internet text, synthetic users will default to someone else’s preferences.
Anything genuinely novel — Kim & Lee showed in their study on AI-Augmented Surveys that accuracy dropped from 98% on familiar questions to 67% on questions never asked before. Brand et al. found fine-tuning on laptops made tablet predictions worse. If the market doesn’t have established patterns yet, the model fills gaps with optimism.
The hidden problem most people miss
Even if synthetic panels perfectly replicated human survey responses — say, 90% accuracy — what would that mean?
Purchase intent surveys have four decades of meta-analyses showing they don’t reliably predict actual purchasing behavior. A synthetic panel that perfectly replicates survey data is perfectly replicating humans’ own poor predictive ability. You’ve automated the gap between what people say and what they do.
Communicating what this means to your team
Synthetic users are not a shortcut around real research. They are a tool that gets better the more real research you’ve already done — and worse the less you have.
If you want to set your team up for success, start here:
Name the decision. What’s the specific question your team wants synthetic users to answer? “Will users switch?” is a very different problem than “which of these three features matters most?” — and the research shows synthetic users handle the second far better than the first.
Audit your data. Do you already have the kind of deep, relevant data that would support that prediction? Interview transcripts, behavioral data, rich survey responses? If not, that’s your first investment. Start collecting good data first.
Test before you trust. Run the synthetic approach against real data you already have. Hold back answers and see if the synthetic user can predict them. If you can’t measure accuracy on known ground, you can’t trust the output on unknown ground.
If your team is evaluating a synthetic user platform
Many teams won’t build their own — they’ll buy a tool. If that’s your situation, ask three questions before signing anything:
Where does their data come from? Are they building synthetic users from your data, their own, or population-level datasets? The source determines the ceiling on accuracy.
How is your data handled? If they want you to upload interviews or customer data, vet their storage and security the same way you would any research platform.
Can you see how they measure accuracy? If there’s no transparent methodology — or if they quote a single accuracy number with no context on what it measures — the number is marketing, not evidence.
Lastly, if your team is evaluating synthetic users or already using them and has specific questions, feel free to comment or reply to this email.
If you’ve made it this far, I’d love your input about the future format of this newsletter 🙋♀️
—
Have a productive start to April ✌️
-Caitlin